


Risk Management Products
ProTrader Plus provides a powerful set of risk management applications.
Risk Manager™
Margin Calculator™
Options Calculator™
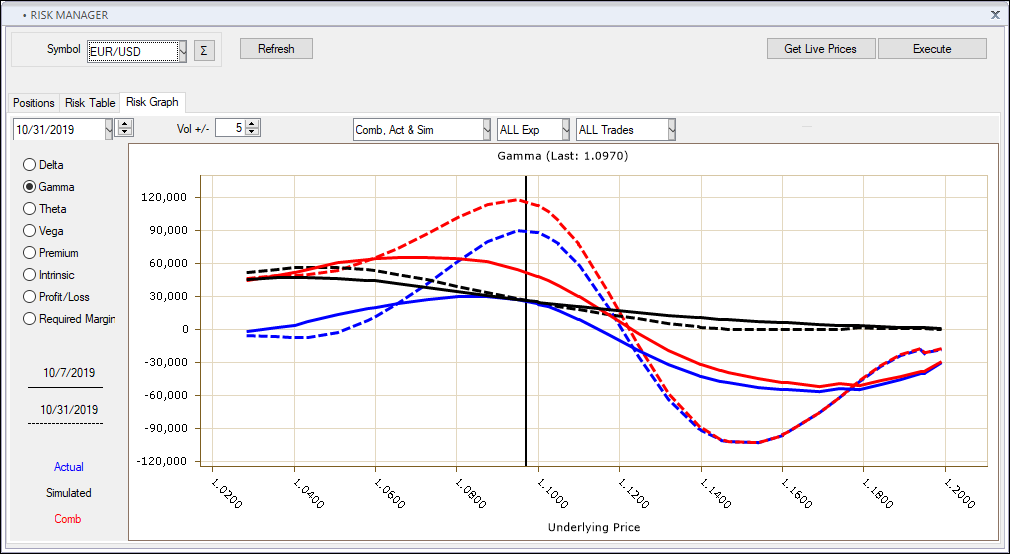
The Risk Manager™
Risk Manager™ provides comprehensive post-trade P&L portfolio analysis tools in one screen for spot, options, CFDs, or all combined positions within a given symbol.
Displays an aggregated and detailed graphical and tabular analysis of all open positions in any given symbol.
Filtering by instrument type, order status and tenor
Time/price/volatility analysis across multiple scenarios.
Strategy simulator for viewing portfolio with added/closed position changes.
The Margin Calculator™
The ProTrader Plus platform combines a portfolio of spot and options positions to determine the margin. For more information on Volatility Based Margining CLICK HERE.
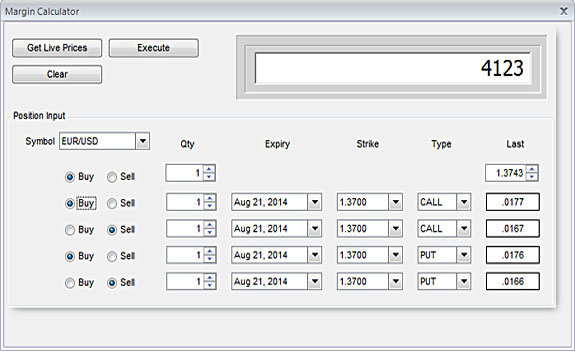
The Margin Calculator™ displays margin requirements based on input of one spot and up to four options positions. Choose to buy or sell, choose the quantity, the expiration, and strike price of the option, and its put or call type. Notice how the required margin automatically updates with the change in the spot price.
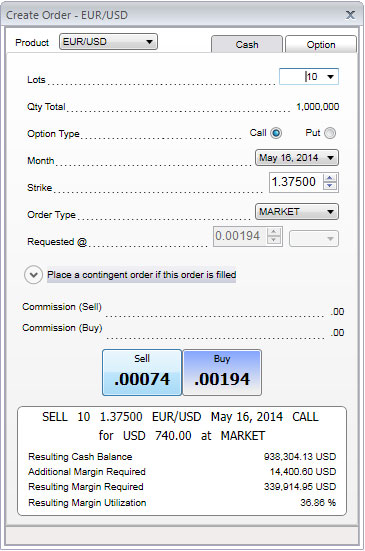
Because proper margin management is essential to trading strategies, the order ticket also displays the margin information including Additional Margin Required, Resulting Margin Required, and Resulting Margin Utilization.
The Options Calculator™
Options Calculator™ enables you to calculate premiums based on cross rate, expiration month, option type (put/call), and strike price. You can see the premium of an options across a change in the underlying price. You can also see the premium lines for 5 different periods – if the underlyer changes today, 25% less time until expiration, 50% less time until expiration, 75% less time until expiration or at expiration (whereby there is only intrinsic value remaining).
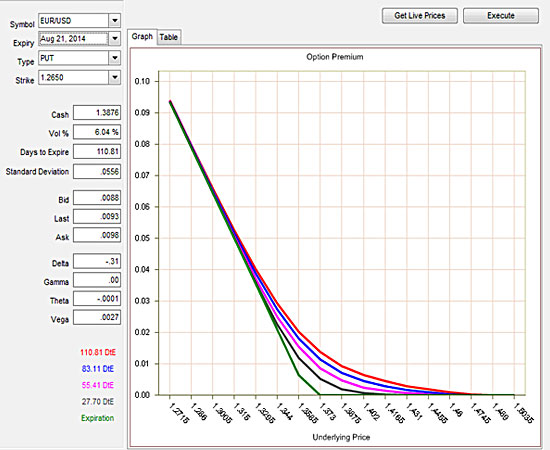
The Option Calculator is an application that allows you to see the effects of price, time, and volatility on the price of an option.
The upper set of controls allow you to specify the option type (Call or Put), option Strike price, and annualized Volatility:
![]()
The lower set of controls has two sections.
The first section allows you to set the range for the Spot Price displayed on the graph. Low specifies the left-most value and High specifies the right-most value for x-axis:
![]()
The second section allows you to set and choose the time horizons that are to be calculated and shown on the graph.
Up to 5 different times (including expiration day at 0 Days) can be shown. Select (or un-select) a specific day by clicking the checkbox next to various values:
![]()
The graph will automatically recalculate changes you make in any control and display the new results.
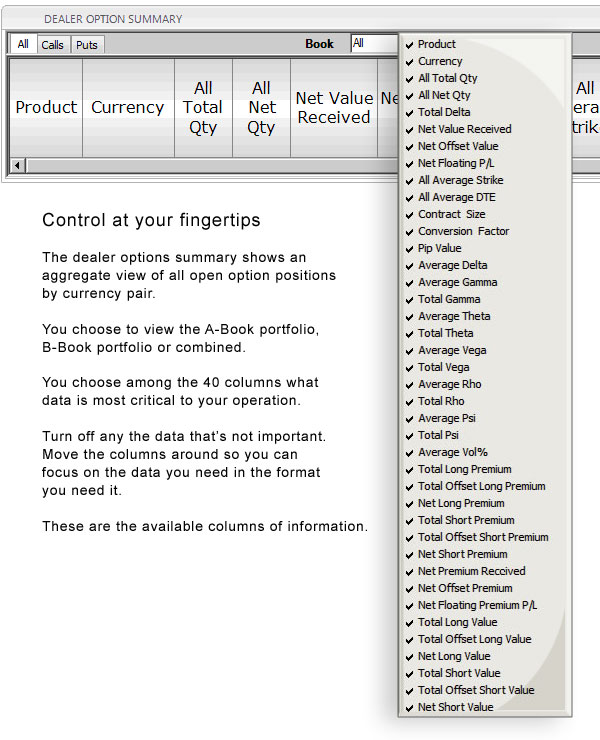
The Dealer Option Summary