


Option Value Simulator
The Option Value Simulator is an application that allows you to simulate the movement of a spot market and track how an option would gain and lose value as the spot price changes.
The upper chart in the Option Tester displays a 120-day simulated spot market:
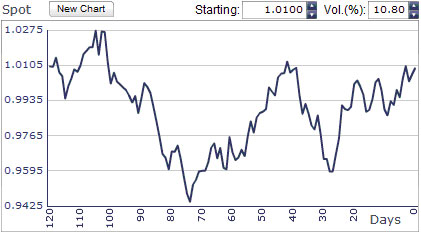
You can choose the Starting Price for the simulation and the market Volatility. (The defaults are set at a spot Starting Price of 1.0000 and a Volatility of 10%.) Once you set either or both the Starting Price and the Volatility to your preferences, the chart will become grayed out, indicating that it no longer shows a simulation based on the default settings. Click the New Chart button to create and display a new spot market price simulation (the corresponding option value chart is explained below).
The lower chart displays the value of an option corresponding to the simulated spot market price above:
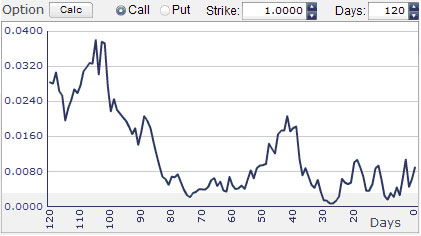
You can choose the option type (Call or Put), the Strike price, and the Days to expiration for the option. (The defaults are set for a 120-day 1.0000 Call.) Once you have changed any of the option settings, the option chart will become grayed out, indicating that it no longer shows the option value based on the default settings. Click the Calc button to calculate and display a new set of option values.
A few things to note about what you will see when using the Option Value Simulator:
The option chart for call options will often look very similar to the spot market chart, except in cases where the spot market falls dramatically.
The option chart for a put option will often show a “mirror image” for that of the call option with the same settings.
Either the call option chart or the put option chart will be equal to zero when Days are equal to zero.
Option Calculator:
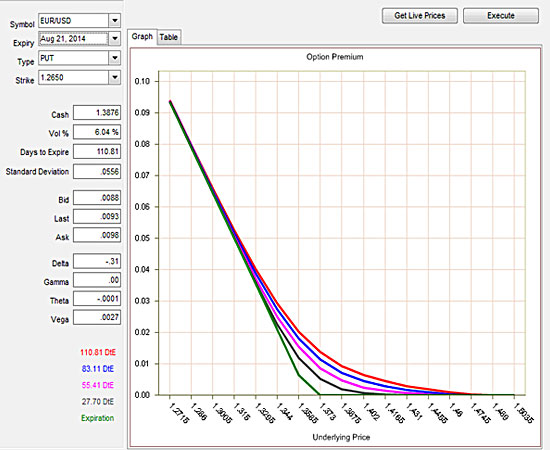
The Option Calculator is an application that allows you to see the effects of price, time, and volatility on the price of an option.
The upper set of controls allow you to specify the option type (Call or Put), option Strike price, and annualized Volatility:
![]()
The lower set of controls has two sections.
The first section allows you to set the range for the Spot Price displayed on the graph. Low specifies the left-most value and High specifies the right-most value for x-axis:
![]()
The second section allows you to set and choose the time horizons that are to be calculated and shown on the graph.
Up to 5 different times (including expiration day at 0 Days) can be shown. Select (or un-select) a specific day by clicking the checkbox next to various values:
![]()
The graph will automatically recalculate changes you make in any control and display the new results.